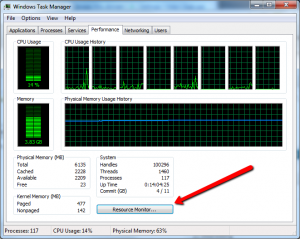
Windows has always made it very easy to see what your CPU is doing, and how much memory you’re using, via Task Manager. However, the bottleneck in many cases is disk I/O, and it’s not nearly as obvious. Though you could add additional I/O-related columns in the task manager process list, I/O isn’t summarized in a graphical form. Windows Resource Monitor does it though, and it’s actually a click away once you’re in Task Manager:

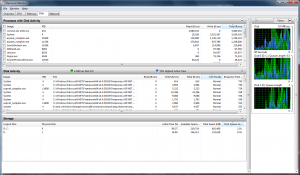
If you fire it up, the UI is oriented around the resource you’re looking to monitor – CPU, Memory, Disk, and Network. The Disk panel has graphs of Disk Queue Length, which you’ll recognize if you’ve used Perfmon before as one of the most useful counters for spotting I/O bottlenecks:

After discovering it, I dropped a second drive in my machine to do builds on. There is still a lot of activity on the C: drive that I’ve yet to pick through, but moving the builds to a different drive has made a noticeable difference in the responsiveness of my system while the compiler is running.